
Description
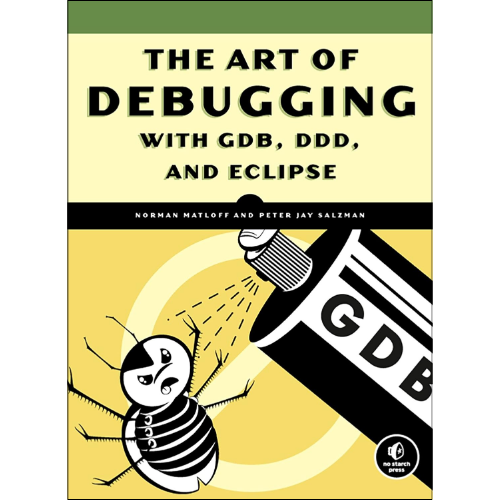
Debugging is crucial to successful software development, but even many experienced programmers find it challenging. Sophisticated debugging tools are available, yet it may be difficult to determine which features are useful in which situations. The Art of Debugging is your guide to making the debugging process more efficient and effective.
The Art of Debugging illustrates the use three of the most popular debugging tools on Linux/Unix platforms: GDB, DDD, and Eclipse. The text-command based GDB (the GNU Project Debugger) is included with most distributions. DDD is a popular GUI front end for GDB, while Eclipse provides a complete integrated development environment.
In addition to offering specific advice for debugging with each tool, authors Norm Matloff and Pete Salzman cover general strategies for improving the process of finding and fixing coding errors, including how to:
–Inspect variables and data structures
–Understand segmentation faults and core dumps
–Know why your program crashes or throws exceptions
–Use features like catchpoints, convenience variables, and artificial arrays
–Avoid common debugging pitfalls
Real world examples of coding errors help to clarify the authors’ guiding principles, and coverage of complex topics like thread, client-server, GUI, and parallel programming debugging will make you even more proficient. You’ll also learn how to prevent errors in the first place with text editors, compilers, error reporting, and static code checkers.
Whether you dread the thought of debugging your programs or simply want to improve your current debugging efforts, you’ll find a valuable ally in The Art of Debugging.


Reviews
There are no reviews yet.